
IPO News Desk
The IPO Winners' Circle: 2016 IPO Leadership
In 2016, the IPO market continued a downward trend in offerings that began the previous year, finishing with 117 deals that raised a total of $21.8 billion. That offering total represents a 37% drop from 2015’s 185 new issues, while aggregate proceeds were down 34% from the $33.4 billion raised the year before. In the past decade, only market-crisis years 2008 (51 IPOs) and 2009 (64 IPOs) produced fewer new issues than 2016.
Contributing to the low number of deals was the ready availability of funding, which enabled companies to stay private longer. Access to private funding has dramatically increased the number of “unicorns”—private companies with more than $1 billion in market capitalization—from about a dozen prior to enactment of the JOBS Act to more than 170 today. Potential IPO issuers have been happy to stay private to avoid regulatory requirements and the pressure to operate to meet quarterly earnings numbers.
A strong year for M&A also impacted the number of completed IPOs in 2016. Private equity investors found better returns through acquisitions than were available in the IPO market for much of the year. One high-profile example was Petco Holdings’ which withdrew its planned IPO in February in favor of a $4.6 billion offer from private investors. Acquisitions well in excess of $1 billion were commonplace in 2016, especially in the tech industry which historically is a primary producer of IPO issuers.
The year also lacked the kind of marquee names that can generate buzz around the IPO market and draw in otherwise reluctant IPO investors. Those companies that had a little name recognition, such as Valvoline and US Food Holdings, were unable to generate even a 10% gain on their first trading day.
US Food was among 2016’s largest IPOs, and was one of only four deals to top $1 billion in proceeds. The largest IPO of the year was the $1.4 billion offering by ZTO Express (Cayman) on October 26th. The other issuers whose offerings topped $1 billion in proceeds in 2016 were Athene Holding ($1.08 billion in December) and MGM Growth Properties ($1.05 billion in April).
IPO market performance was weighted toward the middle of the year, with the busiest quarter being the third with 40 offerings. The first quarter saw only 11 companies go public in the U.S., the lowest quarterly total since only one company completed an IPO in the first three months of 2009. 2016 also ended slowly with November posting only five new issues, followed by seven in December. October was the year’s busiest month with 21 new issues, three more than in September.
For a fourth consecutive year, pharmaceutical preparations companies (SIC 2834) were the top performers in the IPO market. SIC 2834 companies accounted for 24 new issues, which is 20.5% of the year’s 117 deals. The next closest industry was blank checks companies (SIC 6770) with 13 offerings. Blank checks companies also finished second in 2015. Prepackaged software companies repeated their third place finish in 2016 with eight new issues, one ahead of biological products companies. The 24 deals by pharmaceutical companies in 2016 generated an aggregate $2.1 billion in proceeds, representing 9.6% of all IPO proceeds for the year. Blank checks deals tallied $3.2 billion in proceeds, topping all other industries in 2016.
The number of non-U.S. companies that went public in U.S. markets fell for the second straight year. In 2016, 30 companies incorporated outside the U.S. made their public market debuts in the U.S., down from 47 the year before and 70 in 2014. China was the top location for non-U.S. IPOs with six. Bermuda was home to three new issuers, while Switzerland and the Netherlands each produced two IPO companies. Israel, which had tied for first in 2015 with seven new issuers, was home to only one IPO company in 2016. One new issuer in 2016 hailed from Argentina, which had not seen a company go public in U.S. markets since March 2012.
2016’s top three first-day performances were turned in by prepackaged software companies. Leading the way was Nutanix with a 131% first-day gain on September 29th. The virtual storage platform provider was the only IPO company in 2016 whose shares more than doubled in value on their first trading day. Twilio was the next best first-day performer at +91.9% after one day of trading, followed by Coupa Software at +84.9%. Twilio finished the year with a 92.3% gain, making it the eighth best aftermarket performer of the year. The top performance was turned in by Acacia Communications with a 168.5% rise between its May 12th debut and the end of the year.
And now for the IPO professional leaders of 2016 – The IPO
Winners’ Circle.
IPO Law Firms – The
ranks of IPO active law firms decreased for the second year in a
row to 105 from 139 in 2015 and 166 in 2014. In 2016, five firms
reached double digits in number of assignments, down from 10
double-digit firms in 2015. Nineteen law firms hit double digits
in 2014.
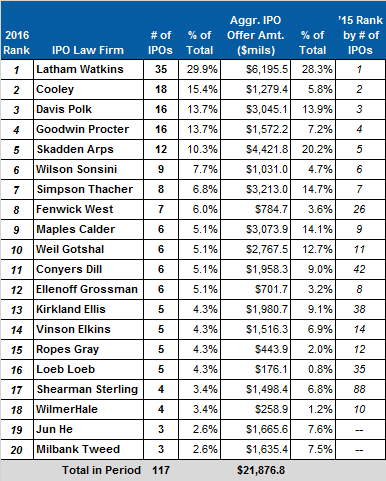
Lower number of deals aside, 2016’s law firm rankings look very similar to 2015’s, with all of the top seven firms claiming the same spot they had the year before. Leading the way for the sixth consecutive year was Latham & Watkins. The firm advised on 35 IPOs last year, 14 fewer than its 2015 industry-leading total. Latham’s representations accounted for 29.9% of the IPO market in 2016, up from its 26.5% share the prior year.
Cooley claimed second place for the third straight year with 18 representations. The firm worked on two more IPOs than Davis Polk & Wardwell and Goodwin Procter. Year-over-year, Davis Polk’s total number of assignments dropped from 26 to 16, while Goodwin Procter’s fell from 24 to 16.
Skadden, Arps, Slate, Meagher & Flom repeated its 5th place finish in 2016. The firm worked on 12 IPOs, down from 17 assignments in 2015 and 37 in 2014. Skadden finished last year four representations ahead of the next closest firm, Wilson, Sonsini, Goodrich & Rosati. Although Wilson Sonsini’s total fell from 13 in 2015 to nine last year, the firm held on to the number six spot in the annual rankings.
Wilson Sonsini’s nine IPOs edged out Simpson Thacher & Bartlett, which had eight representations. Simpson Thacher ranked 7th for the year, just ahead of Fenwick & West. Rounding out the 2016 top ten were Maples and Calder and Weil, Gotshal & Manges, each with six assignments. Weil Gotshal replaced WilmerHale in the top ten. WilmerHale’s IPO assignments dropped from 10 in 2015 to four in 2016, and its ranking fell from 10th to 18th.
Fenwick & West is one of the few firms whose 2016 total exceeded that of the year before, rising from three in 2015 to seven last year. Another firm that accomplished that feat was Conyers, Dill & Pearman, whose representations grew from two in 2015 to six in 2016. The firm did not rank among the top 20 firms in 2015, but finished in 11th place last year. Similarly, Fenwick placed 26th in 2015, but rose to 8th in the 2016 rankings.
Kirkland & Ellis also improved its ranking in 2016, claiming the number 13 spot after finishing 38th in 2015. Other firms that dramatically improved their rank in 2016 include Loeb & Loeb (up to 16th place from 35th) and Shearman and Sterling (up to 17th from 88th).
By aggregate IPO proceeds generated in 2016, Latham claimed the top spot with $6.19 billion, outdistancing Skadden Arps by $1.7 billion. Latham’s total was well below the $9.87 billion in proceeds that earned it 2015’s number one ranking. Latham’s 2016 total proceeds represented a 28.3% share of the IPO market. Simpson Thacher repeated its 3rd place finish in 2016 with $3.21 billion in aggregate proceeds, barely ahead of Maples and Calder. In 2015, three firms generated aggregate proceeds of $5 billion or more, but only Latham reached that level in 2016.
IPO Law Firms
Winners’ Circle 2016
Top
Twenty IPO Law Firms
Combined Issuer’s & Underwriters’
Representations
Ranked by Number of IPOs
(tie-breaks by
Aggregate IPO Offer Amt.)
-- excludes overallotment
option --
--equal credit for joint representations--
IPO
Vital Signs Subscribers see,
#160. IPO Counsel (IPO Issuer's
plus
IPO Underwriters' Mandates) -
IPO Leadership
Rankings
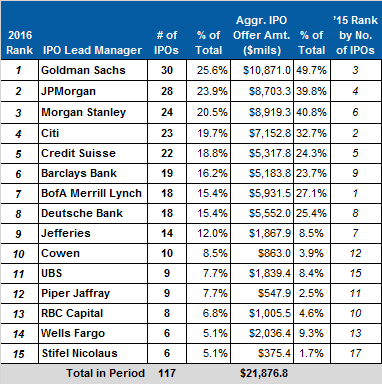
IPO Lead Managers – The number of investment banks acting as lead manager decreased for the second straight year to 56 from 63 in 2015 and 69 in 2014. The number of lead managers with total IPOs in the double-digits also fell from 2015’s total (10 in 2016 and 15 in 2015).
Measured by number of IPOs, Goldman Sachs claimed the number one ranking with 30 deals brought to market. The bank finished in 3rd place in both 2014 and 2015. Bank of America Merrill Lynch, which took top honor in 2015, fell to 7th place last year with 18 deals. Goldman Sachs also was the 2016 winner as measured by aggregate proceeds. Its $10.8 billion in proceeds were $1.9 billion better than 2nd ranked Morgan Stanley.
By number of IPOs, JPMorgan finished in 2nd place with 28 new issues. That marks a two spot improvement over the bank’s 2015 showing. Although its lead manager representations dropped from 31 in 2015 to 24 in 2016, Morgan Stanley improved its ranking from 6th to 3rd. Citi and Credit Suisse rounded out the top five with 23 and 22 IPOs, respectively.
Barclays Bank nearly matched its 2015 total (19 IPOs in 2016 and 20 in 2015), and jumped in the year-end rankings from 9th place to 6th. Jefferies moved in the other direction, falling from 7th to 9th place. Its 14 IPOs in 2016 were four fewer than Deutsche Bank, which was the 8th place finisher for the third straight year.
Although their order in the year-end rankings shifted, the top nine investment banks in 2016 were the same as in 2015. The bank that dropped out of the top ten in 2016 was RBC Capital whose eight IPOs landed it in 13th place. Cowen moved into the number ten spot after finishing 12th in 2015.
UBS and Piper Jaffray each finished last year with nine lead manager assignments, but UBS claimed the number 11 ranking based on aggregate proceeds. UBS moved up four spots in the year-end rankings between 2015 and 2016, while Piper Jaffray dropped from 11th place to 12th.
The year’s most lucrative deals were spread among multiple co-lead managers. ZTO Express (Cayman) employed both Morgan Stanley and Goldman Sachs, while Athene Holding’s underwriting syndicate included four lead underwriters. MGM Growth Properties also employed four lead underwriters—BofA Merrill Lynch, JPMorgan, Morgan Stanley and Evercore Group. US Foods Holding, the only other $1 billion+ IPO of 2016, employed Goldman Sachs, Morgan Stanley and JPMorgan as lead managers. No bank worked on all four of 2016’s largest offerings, but Goldman Sachs and Morgan Stanley were lead managers on three of them.
IPO Lead Managers
Winners’ Circle 2016
Top Fifteen Lead Managers
Ranked by Number of IPOs
(tie-breaks by Aggregate IPO Offer Amt.)
-- excludes
overallotment option --
-- equal credit for joint mandates --
IPO Vital Signs Subscribers see,
#175. IPO Lead Managers -
IPO Leadership Rankings
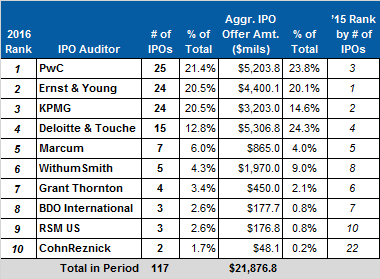
IPO Auditors – The number of accounting firms acting as IPO auditor in 2016 was 15, nine fewer than in 2015 and 12 fewer than in 2014. The Big Four firms continued to occupy the top four spots in the rankings. Marcum finished 5th, eight IPOs behind 4th place finisher Deloitte & Touche.
In 2016, PricewaterhouseCoopers finally broke Ernst & Young’s five-year stranglehold on the top spot in IPO auditor year-end rankings. PwC worked on 25 IPOs, two fewer than its 2015 total, but still one more than both Ernst & Young and KPMG. PwC ranked third in 2015 and second in 2014.
The change atop the year-end rankings reflects a significant drop in Ernst & Young’s IPO work year-over-year while PwC’s remained relatively steady. Ernst & Young’s tally for the year was 24 IPO assignments, compared to 50 in 2015 and 83 in 2014. KPMG finished alongside Ernst & Young in 2016 with 24 IPOs after closing 2015 with 18 fewer IPO assignments than Ernst & Young.
PwC claimed 21.4% of 2016’s IPOs, and 23.8% of the aggregate proceeds. The audit firm’s total proceeds of $5.2 billion was second best in 2016, behind Deloitte & Touche’s $5.3 billion. The industry-leading total was less than half of Ernst & Young’s $11.7 billion in proceeds in 2015, a clear indicator of the sluggish performance of 2016’s IPO market.
While PwC and Deloitte surpassed $5 billion in total proceeds in 2016, Ernst & Young came in at $4.4 billion and KPMG tallied $3.2 billion. The only other auditor to generate more than $1 billion in proceeds was WithumSmith at $1.9 billion. Marcum worked on two more IPOs than WithumSmith, but its seven deals only accounted for $865 million in proceeds.
Nine of the top ten auditors remained the same from 2015 to 2016. CohnReznick, which ended 2015 in 22nd place in the rankings, moved into the top ten in 2016. The firm replaced Mayer Hoffman among the top ten audit firms of the year. RSM US, formerly named McGladrey, moved up one spot in the rankings from 10th to 9th. Grant Thornton and BDO International held on to spots in the top ten, although each firm dropped one place in the 2016 rankings relative to their 2015 finish.
IPO Auditors
Winners’ Circle 2016
Top
Ten IPO Auditors
Ranked by Number of IPOs
(tie-breaks by
Aggr. Offer Amt.)
-- excludes overallotment option --
IPO Vital Signs Subscribers see,
#184. IPO Auditors -
IPO
Leadership Rankings